 |
Light
Pollution Maps |
 |
|
Light
Pollution Maps |
|
| Titelseite
Seiten erstellt von
|
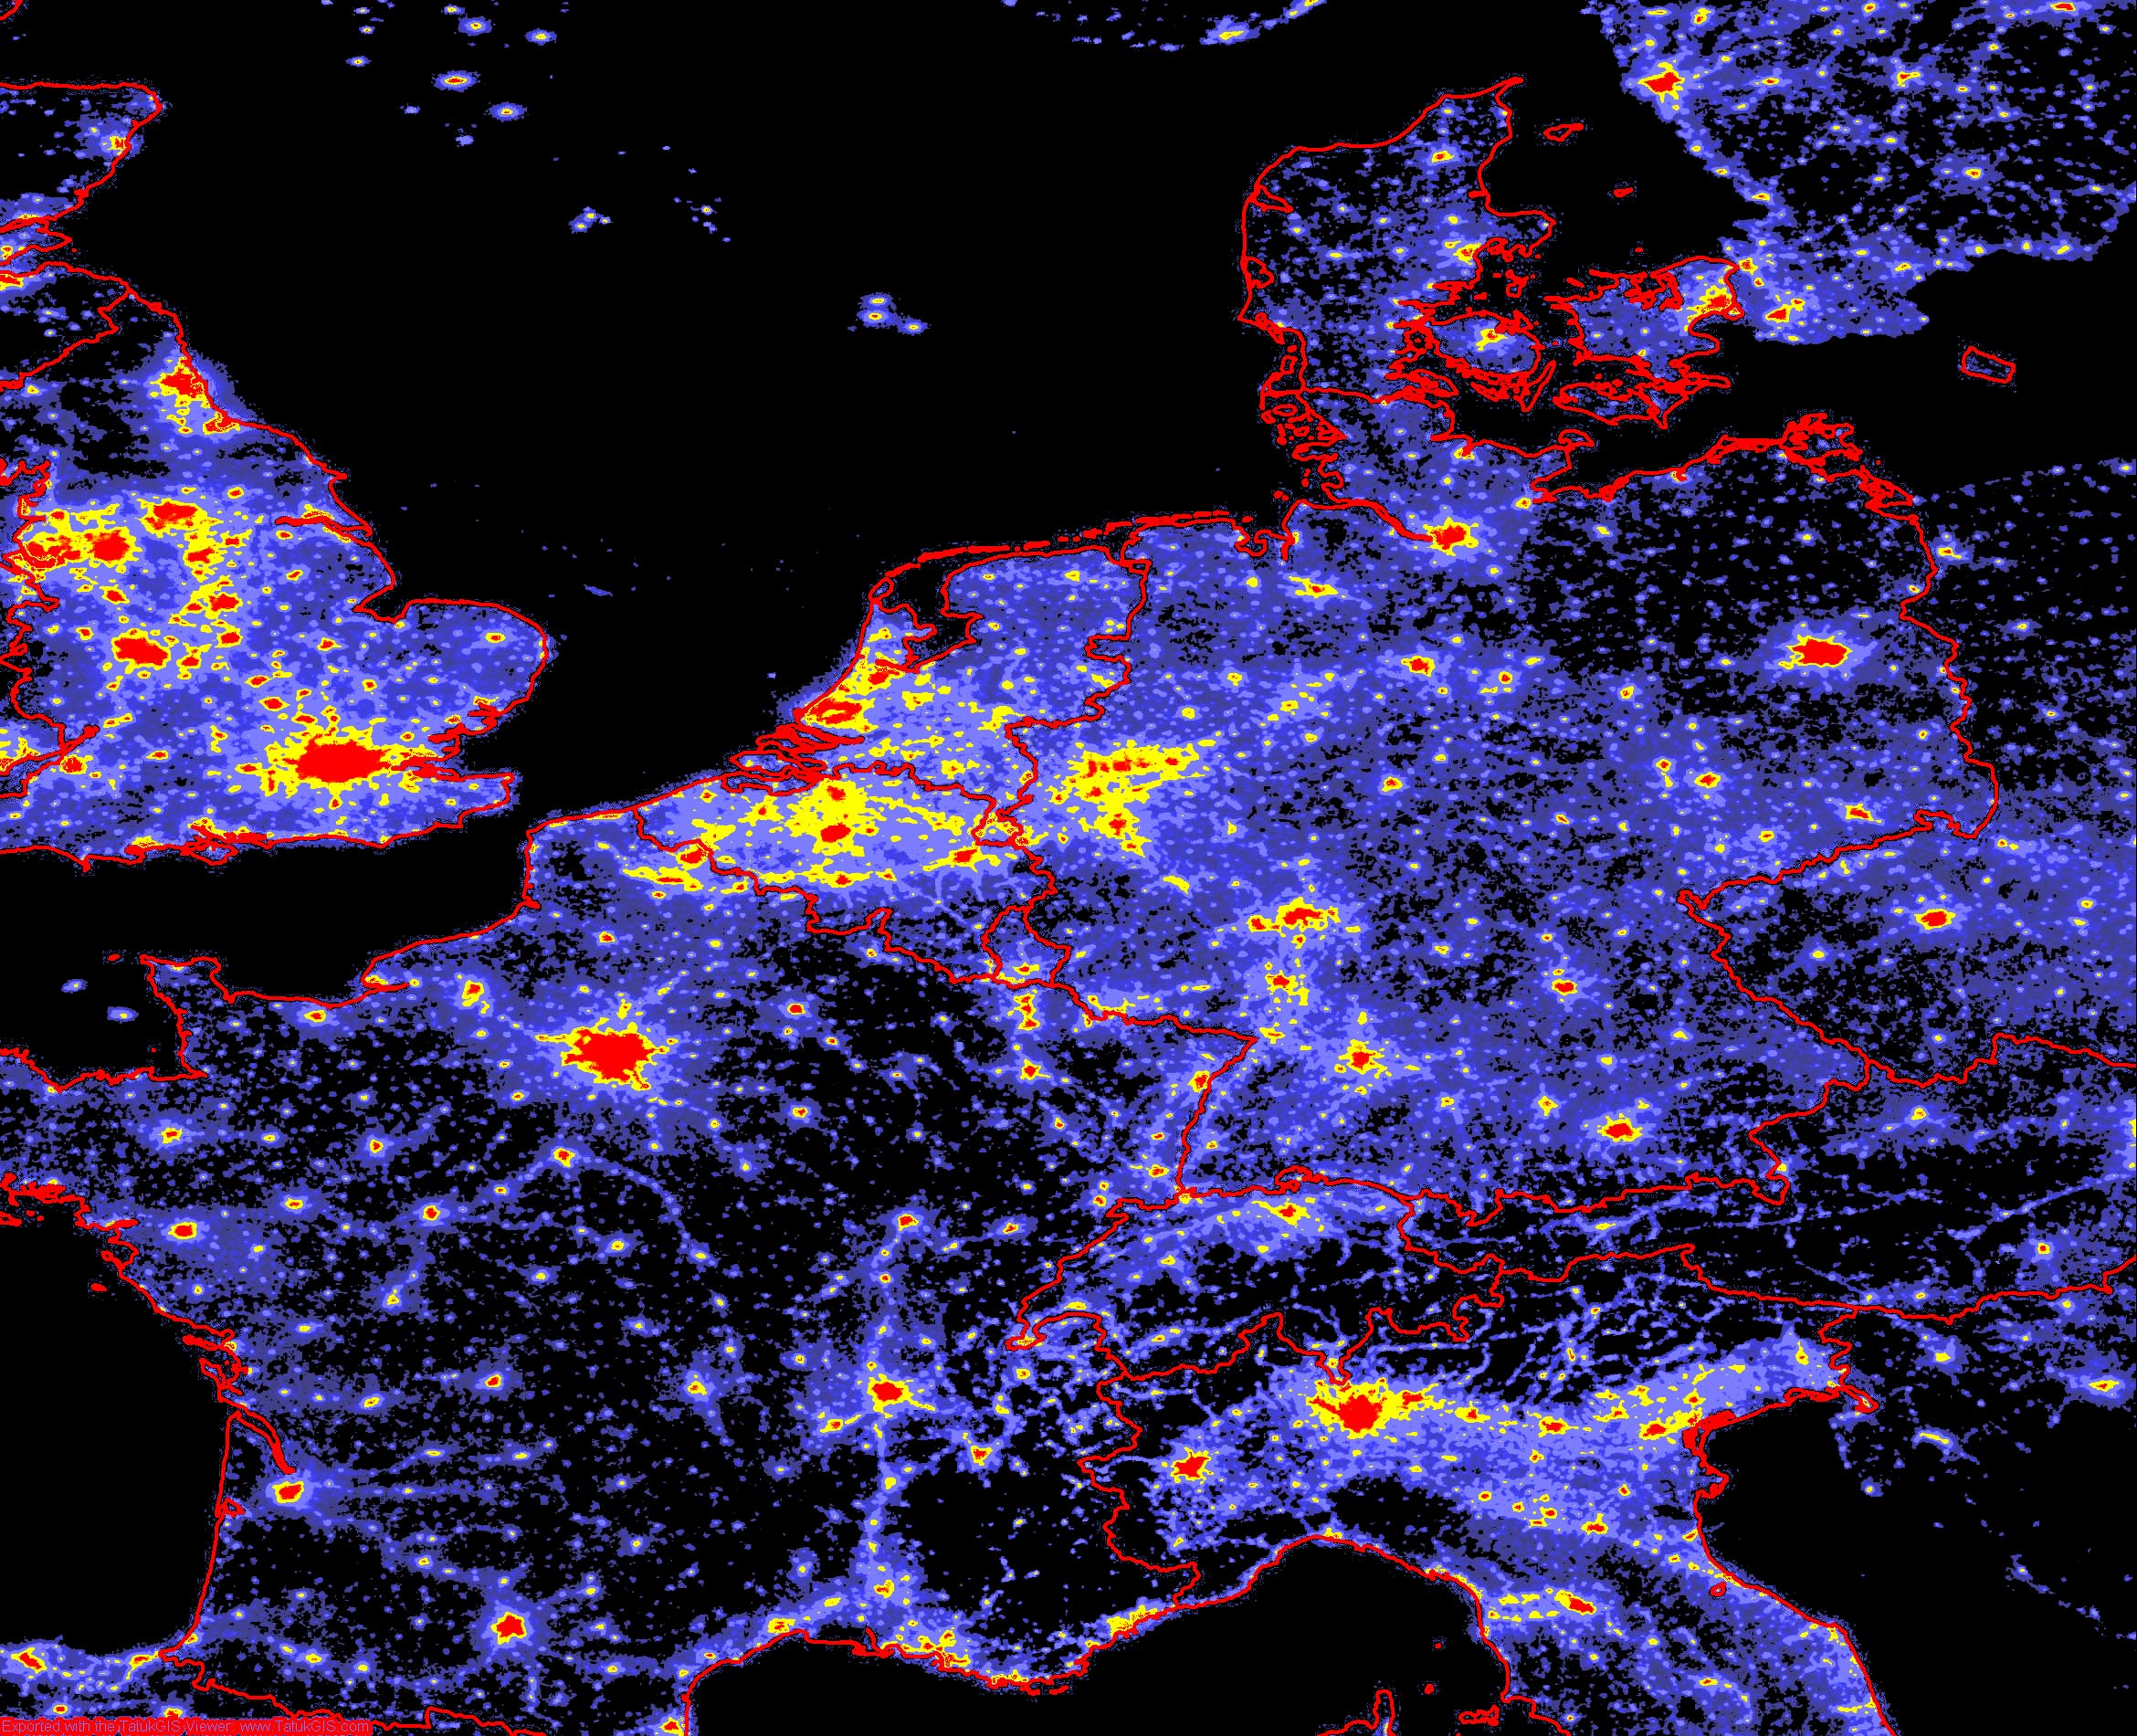
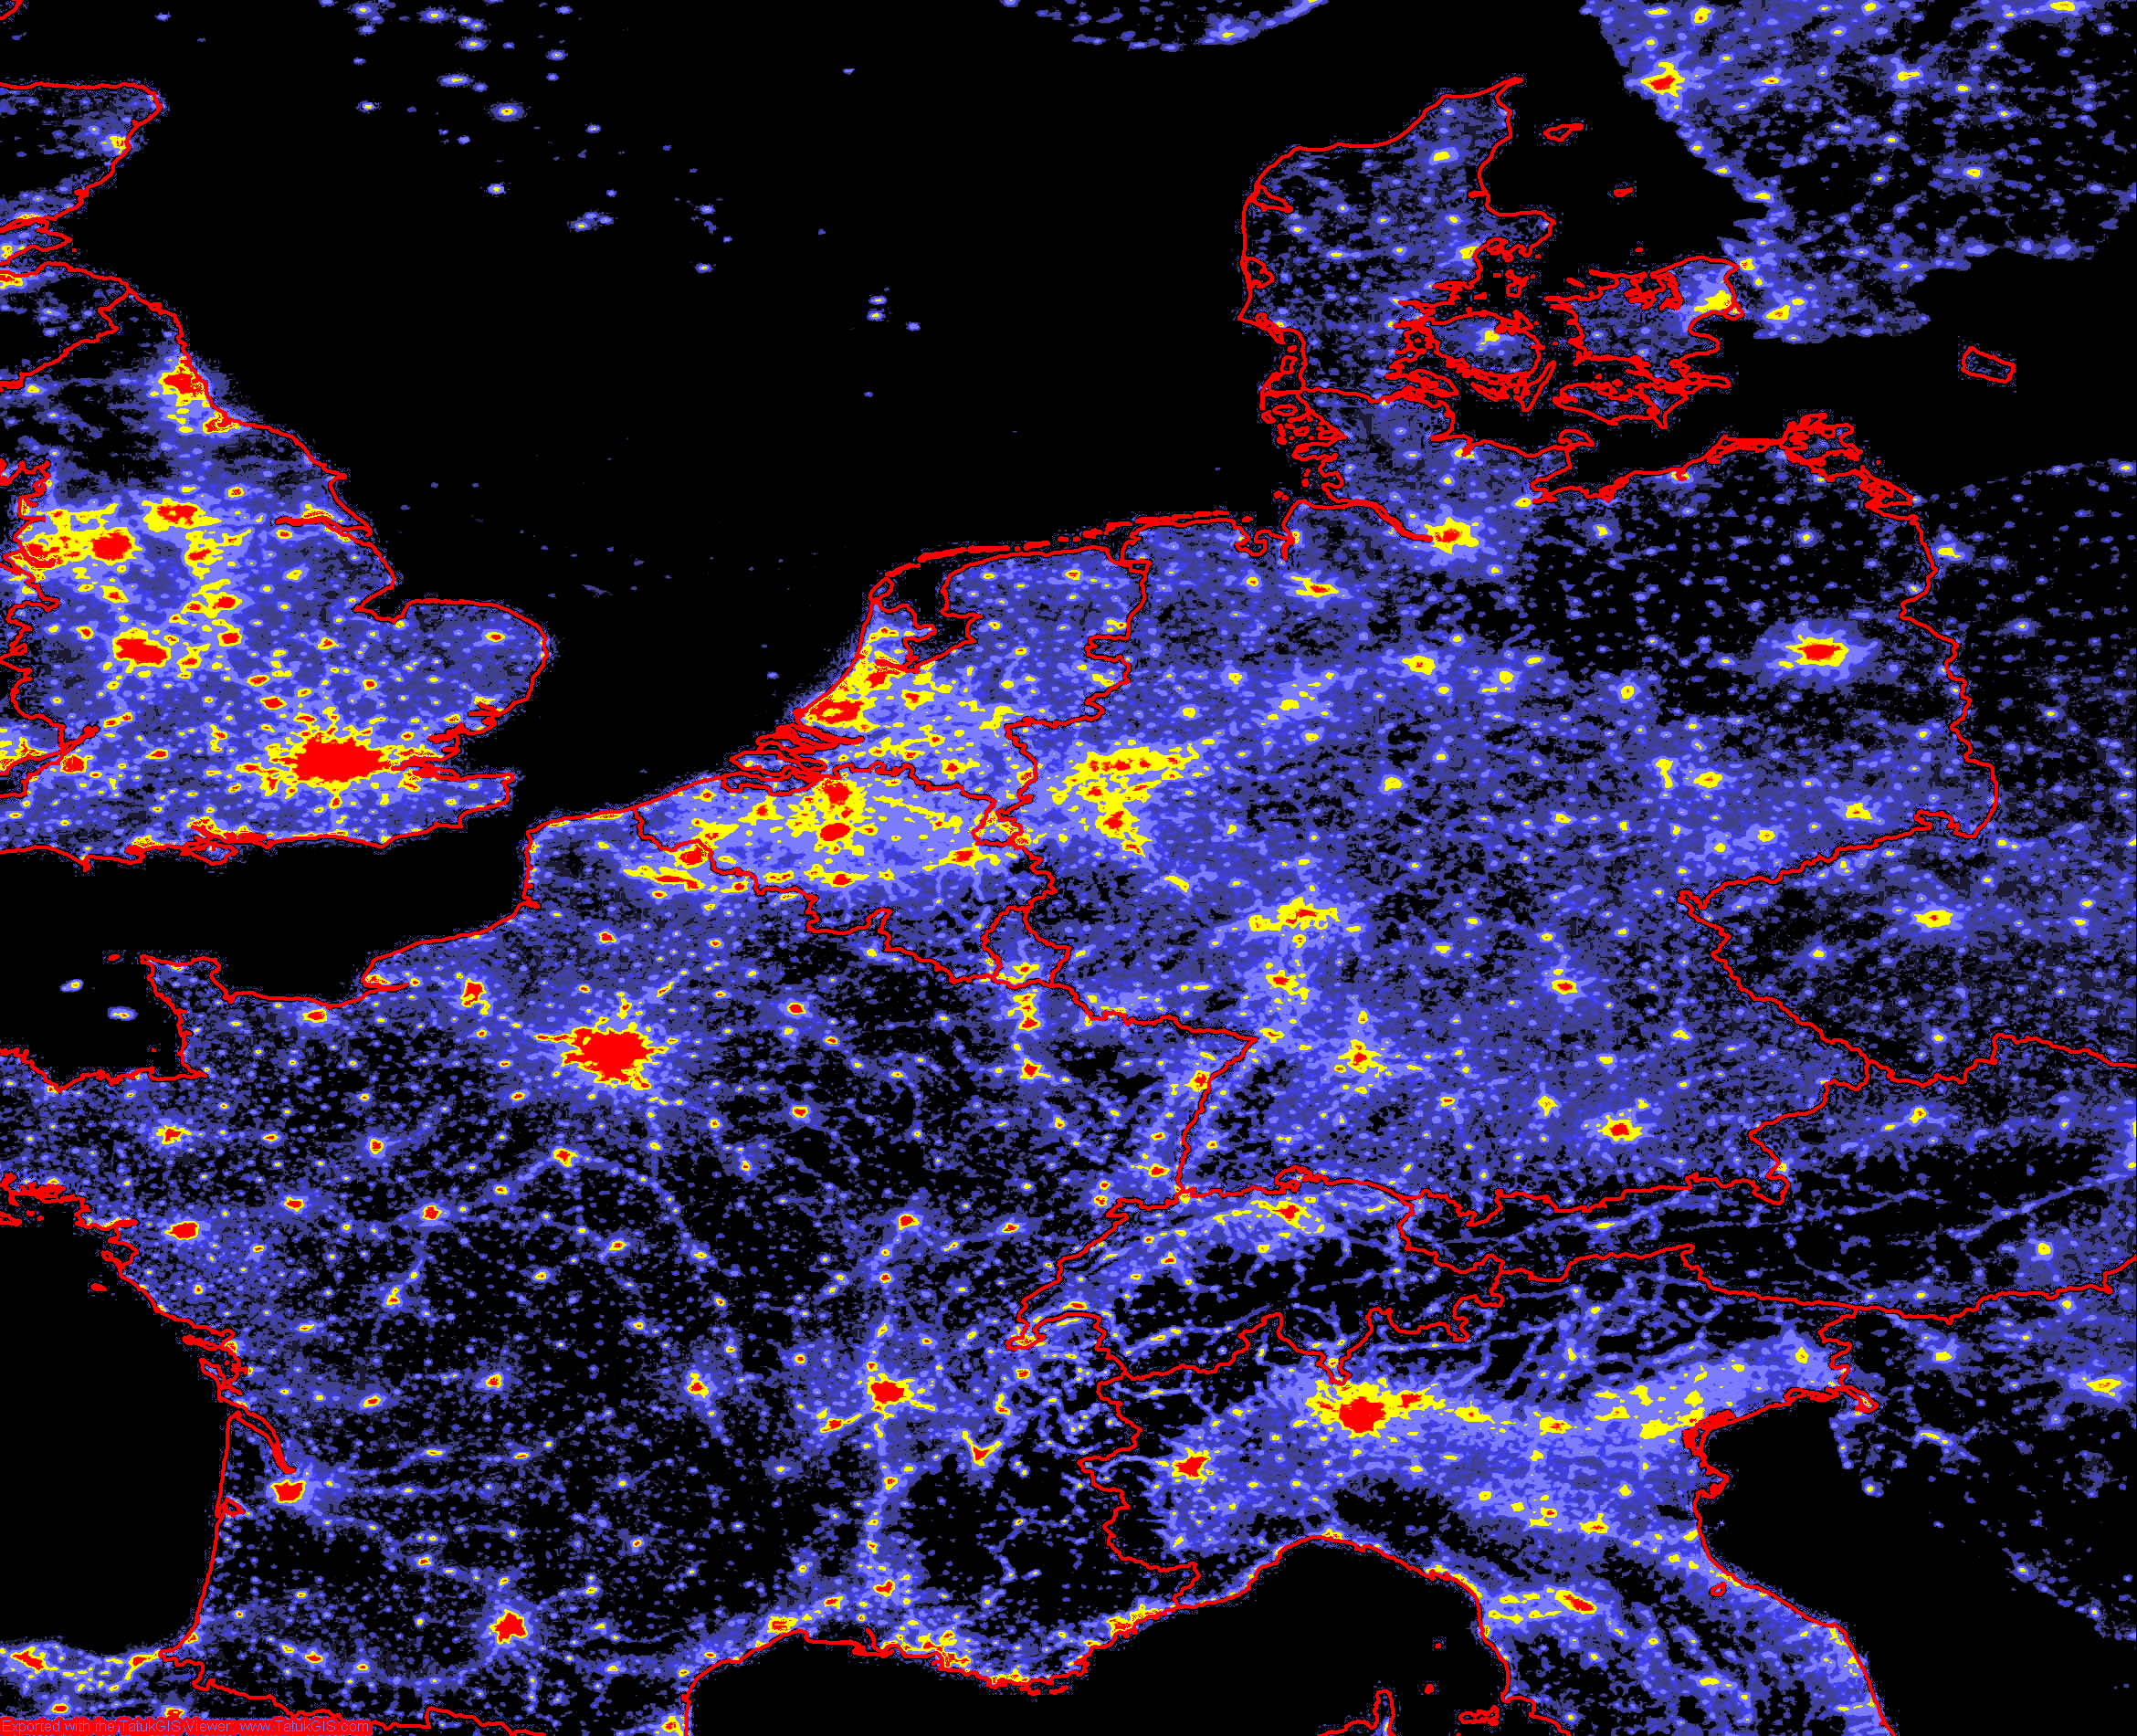
Light
pollution as seen from the DMSP satellites
The american satellites of DMSP (Defense Meteorological Satellite Program) scan the lights of the Earth at night. Actual maps of low resolution can be found under: spidr.ngdc.noaa.gov/spidr/querydmsp.do Such measurements were used to create the fascinating map with artificial light of the Earth geschaffen. In
the meantime data from several satellites from the years 1992 to 2003 have
been compiles. These data are available through the www and have been adapted
by us:
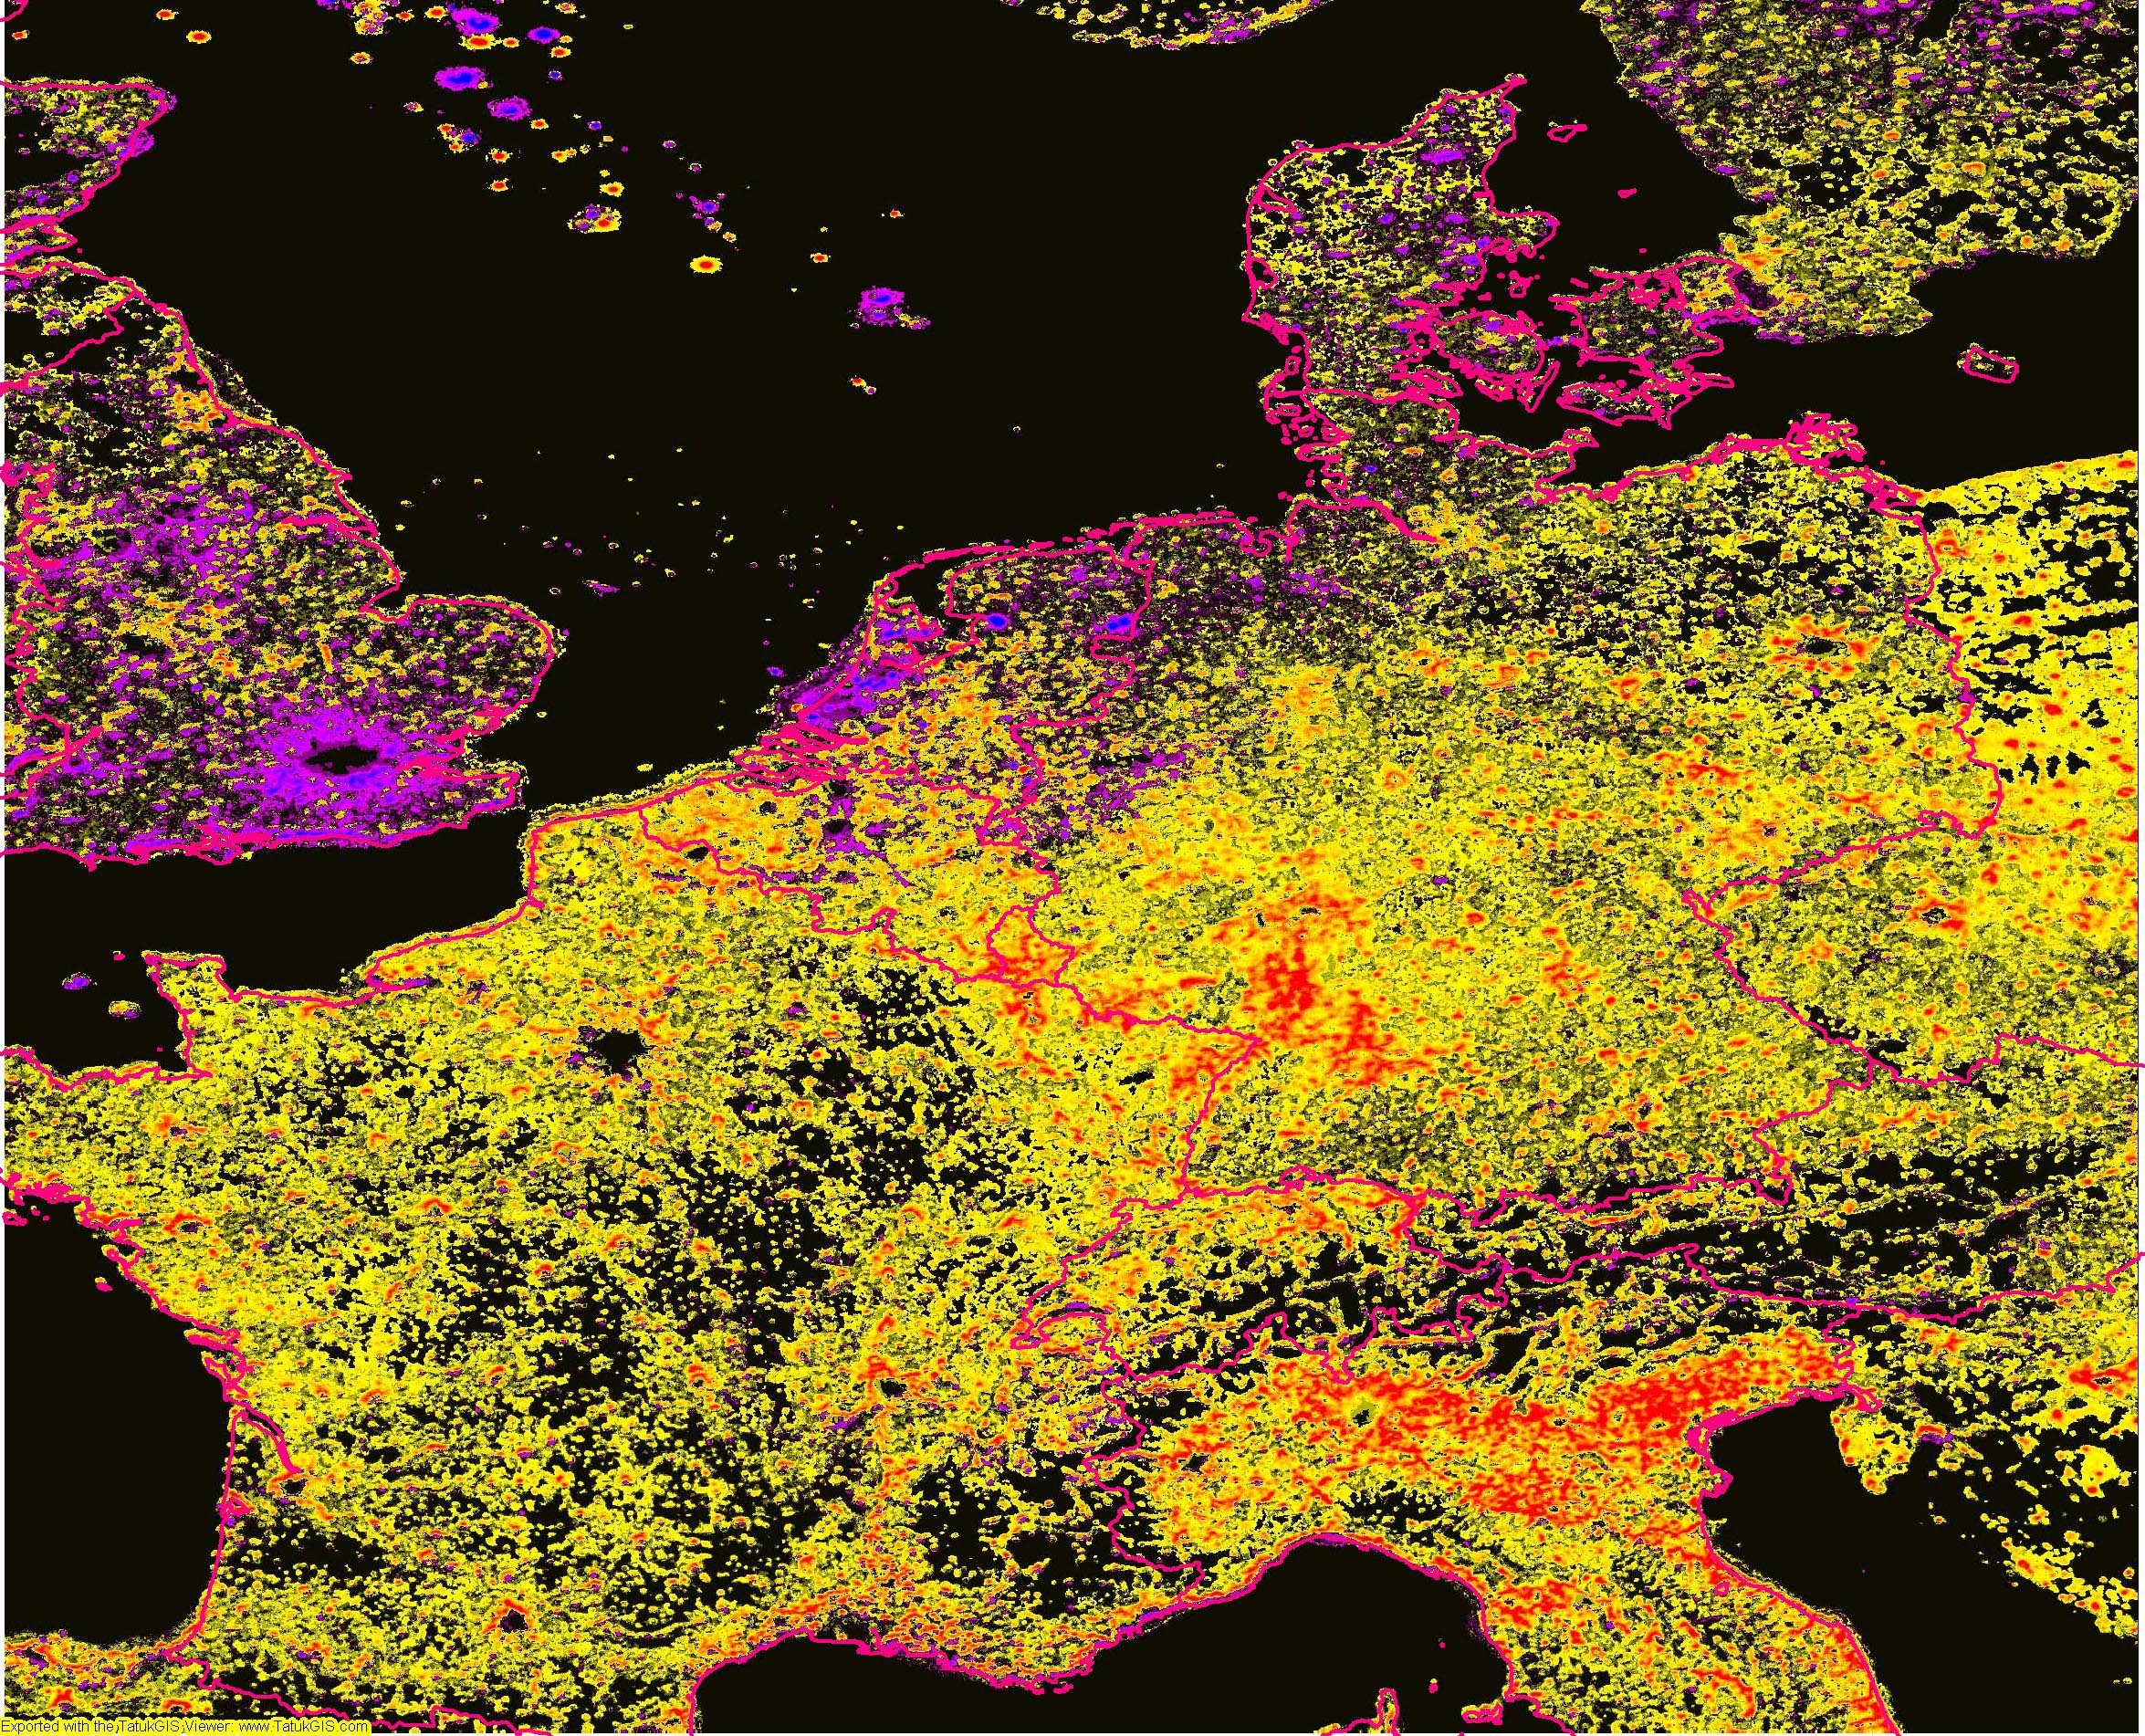
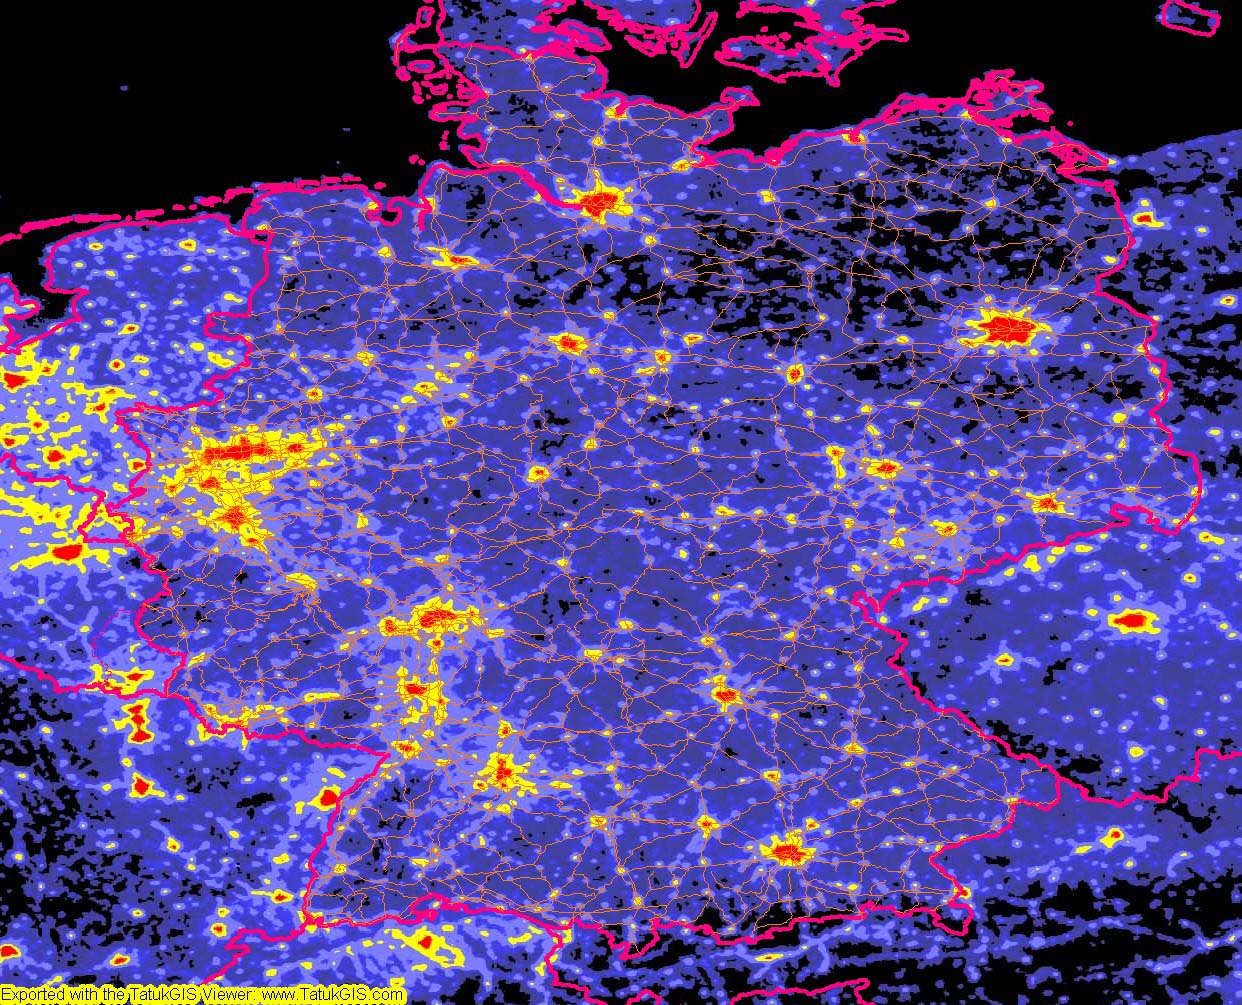
This map shows the difference between 2002 and 1993:
Yellow means an increase of upward light between 1993 and 2002, red an even higher increase. Pink und blue shows a decrease. The decrease in some regions of the Netherlands can be explained with the enormous areas of illuminated greenhouses, that are allowed to switched on only during certain time, in 1993 they were swithced on, but in 2002 off. Why the light around London has been decreased is unknown, it might be an instrumental effect. Pixel size is 0,5', corresponding
to 0,6 km x 1 km in central Europe.
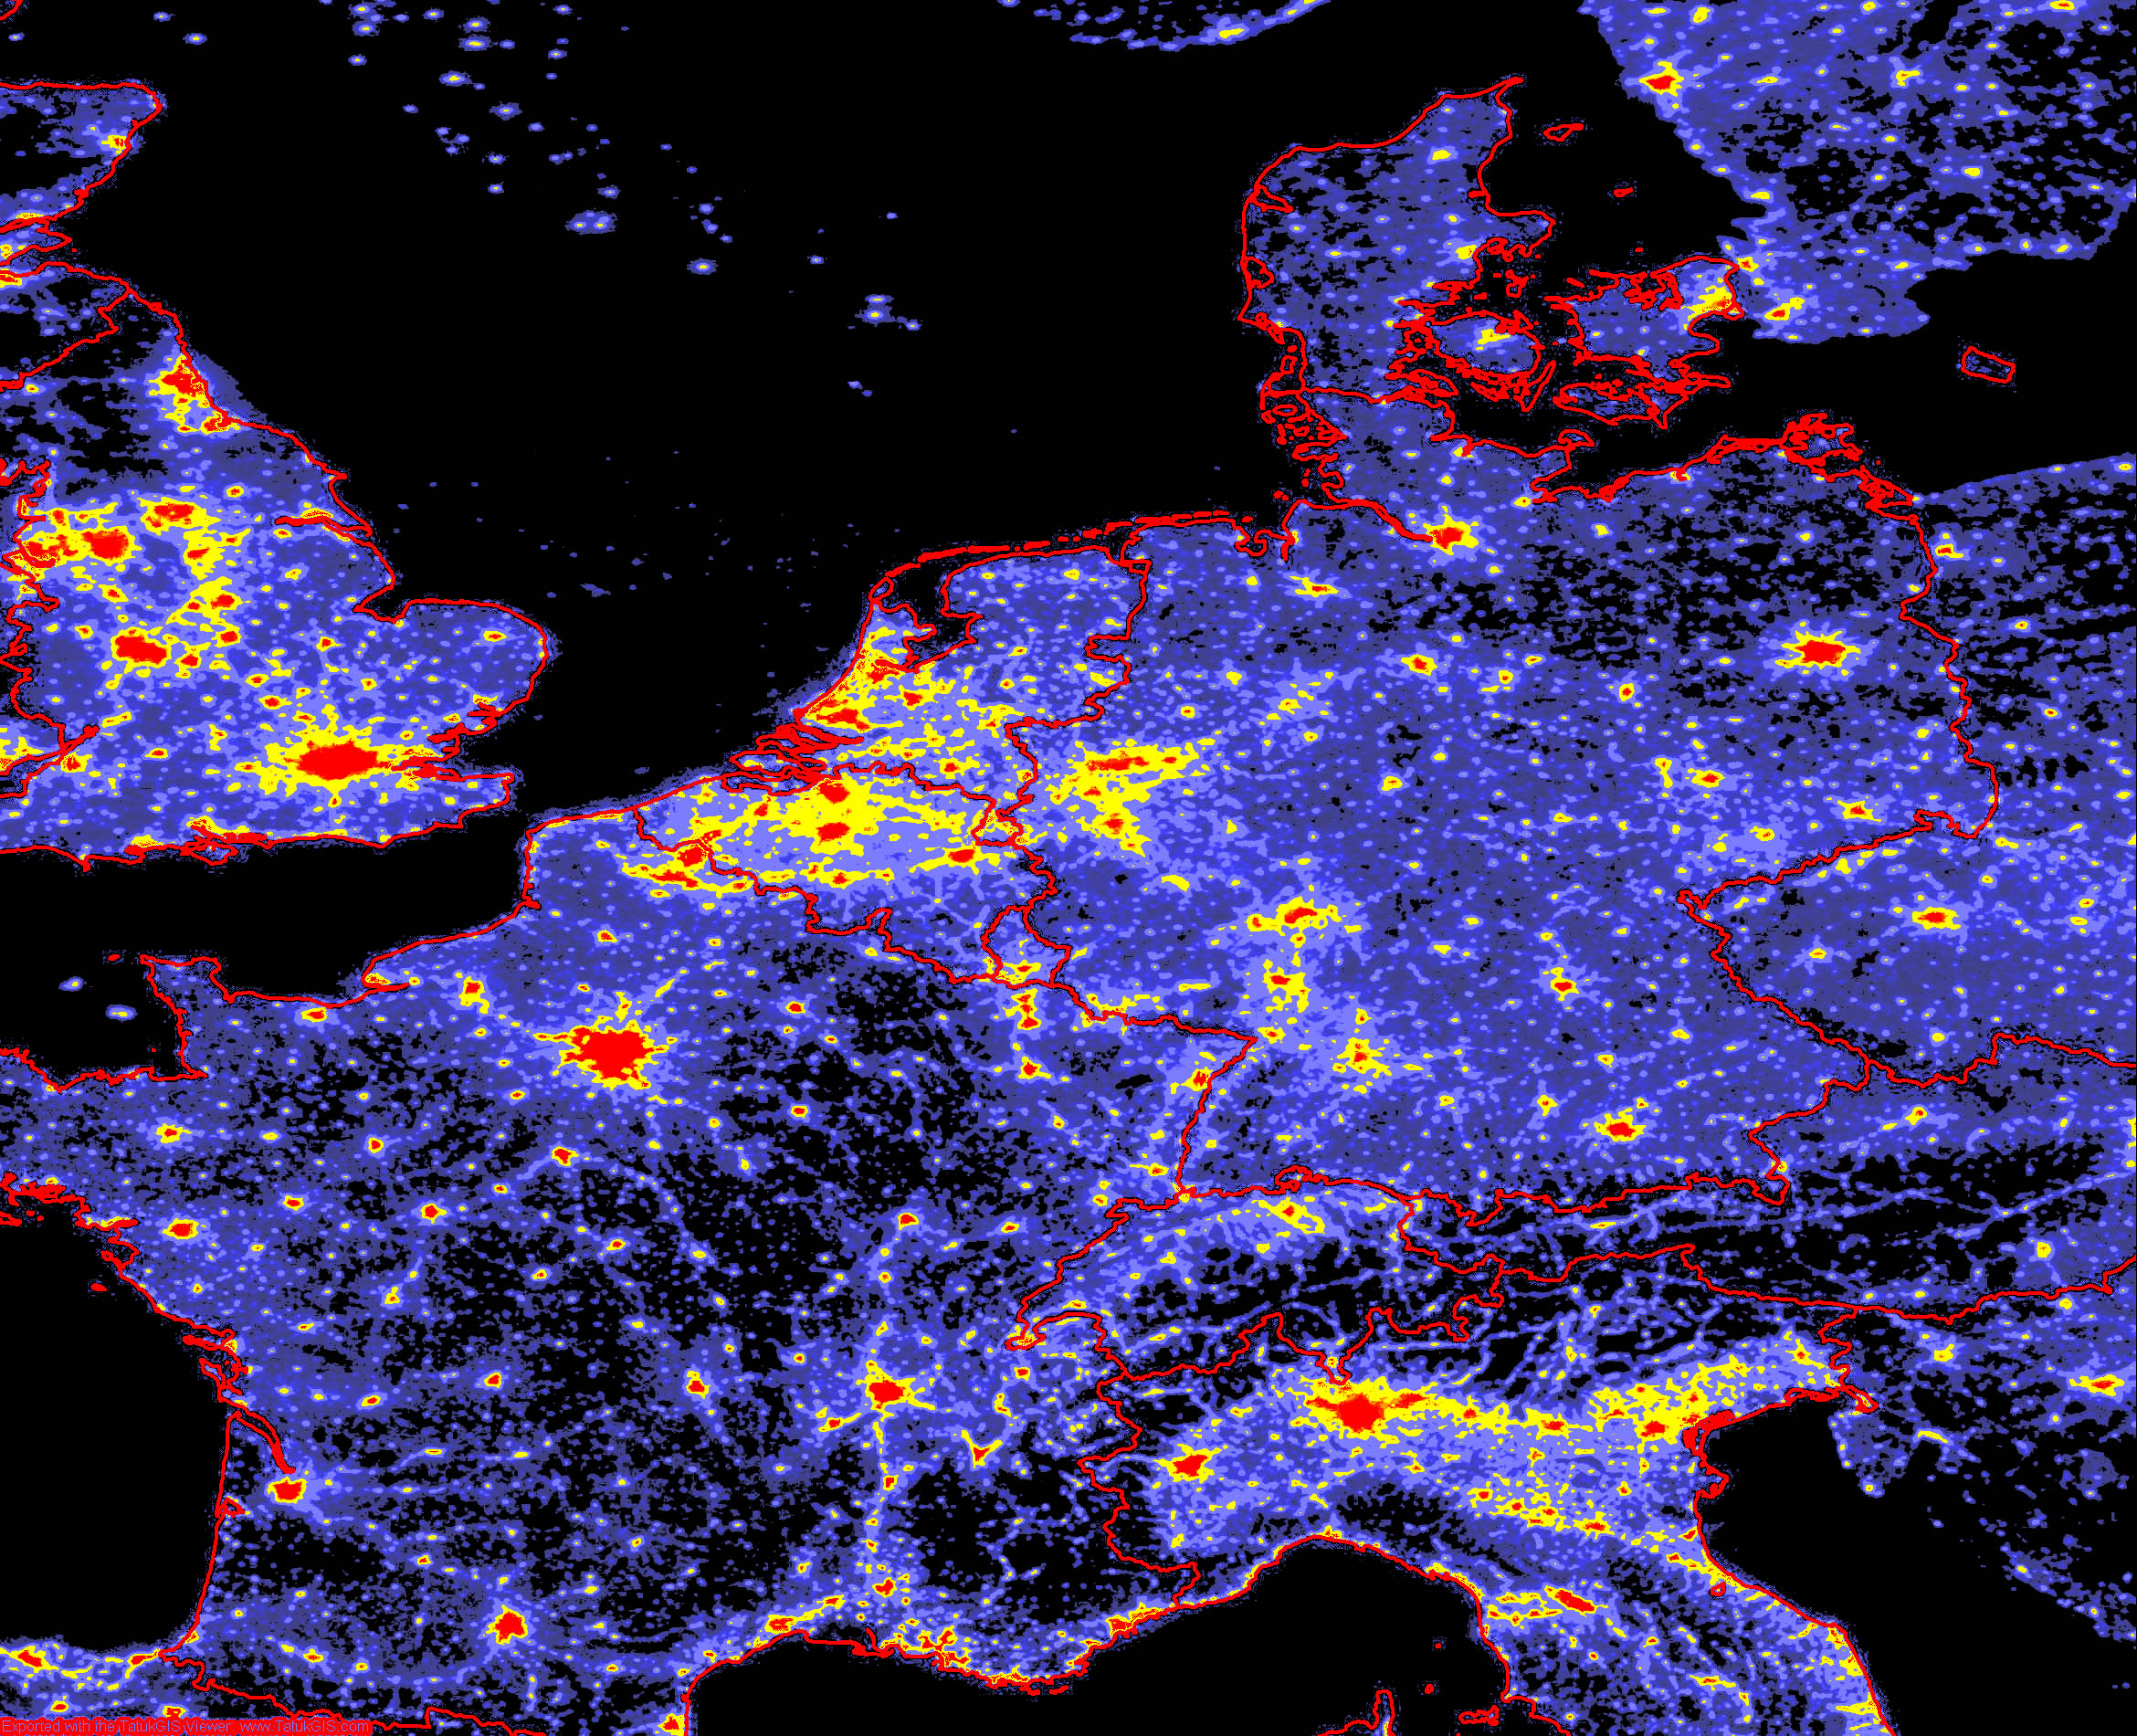
The maps of Frederic Tapissier have a high resolution, but they are based on data for cities and commercial areas, to which he has attributed a certain brightness, and afterwards smeared to model light propagation in the atmosphere. Users of moving map software (Fugawi, OziExplorer, Touratech) can use the georeferenced map and with a GPS the actual position can be shown. Light pollution map for central Europe
for the year 2002, geo-referenced (zip)
Seiten erstellt von Dr. Andreas Hänel - info@lichtverschmutzung.de. Home |